The short answer is No! it’s not or at the least; Not yet!
Recently I had an opportunity to demonstrate a BI solution to an organisation in the recruitment industry with fairly complex reporting needs. They had data spread out in different databases. Some in a CRM system, some in a Financial system and some others in silo data sources.
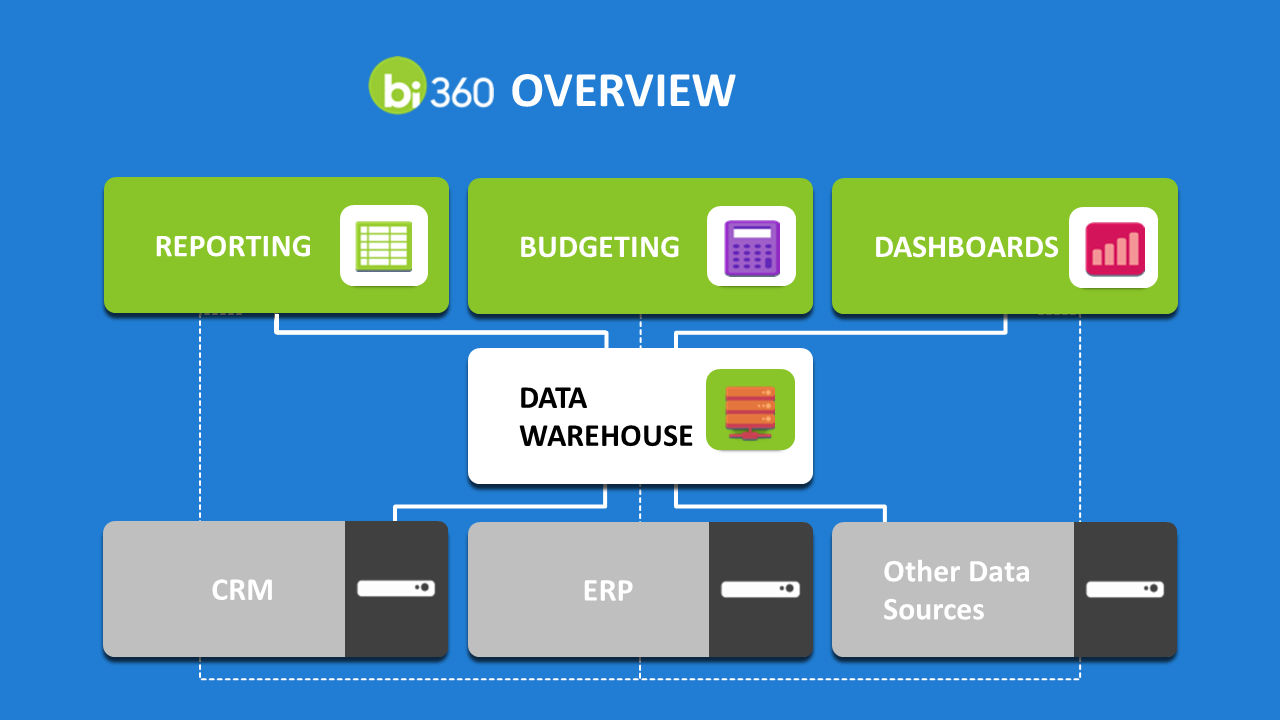
Whilst they did have strong financial reporting needs, they also wanted good meaningful dashboards which were easy to build and didn’t have to depend on their IT experts. After evaluating their needs and understanding their end user skills, I decided to propose a combined solution of a data warehouse and financial reporting using BI360 from Solver and Microsoft Power BI for data visualization and dashboards. I demonstrated the data warehouse technology and the ease of standard financial reporting with BI360 and then moved on to demonstrate the ease of data visualization and dashboards using Power BI. Of course, I used the data warehouse as the source data for Power BI. I thought I was clever and had done a fantastic job in offering a comprehensive solution.
But soon during the Q&A, I realized the team sitting through the demo were a bit confused. They asked” If Microsoft Power BI can connect to any source data, why do we need a data warehouse?” Why can’t we simply use Power BI to connect to the data sources and generate reports?
A good question. Now, I had to spend another hour explaining why they needed a data warehouse and how it was different to simply using Power BI to connect to the raw data sources.
Most search engines define Business Intelligence as “a data analysis process aimed at boosting business performance by helping stakeholders make more informed decisions”.
For a robust and reliable business intelligence solution, it is essential to separate out the transactional data from the actual reporting environment. For eg: Most users think that their standard ERP system should come with a robust reporting option that allows them to analyze, slice and dice data whenever and however they wish to. Well, yes and no! Whilst most ERP systems do have a reporting function inbuilt, they are not designed to provide Business Intelligence. The standard reporting functions within their ERP is primarily built to generate standard financial reports. When you separate out the ERP (transactional data) from the reporting environment by having a separate reporting tool such as BI360 or Power BI, then you have the flexibility to analyze data, slice and dice and get some intelligent statistics. However, for this to work, you need to have a reliable clean data source.
Usually the data in your traditional data source such as your ERP or your CRM contains unclean data, duplicates, errors, lower case, upper case, etc. All of these need to be checked, corrected and stored in a structured manner under the right dimensions and measures. In addition, most organizations have integrated data solutions. In such cases, their CRM is probably integrated with their ERP system. More often than not, when someone in sales changes data in their CRM system, it does not automatically update the respective tables in the ERP system. Now, you end up with two different pieces of information carrying the same transactions. Such errors need to be cleaned up and made consistent to provide for proper and accurate reporting needs. Hence the need for a structured and well planned data warehouse.
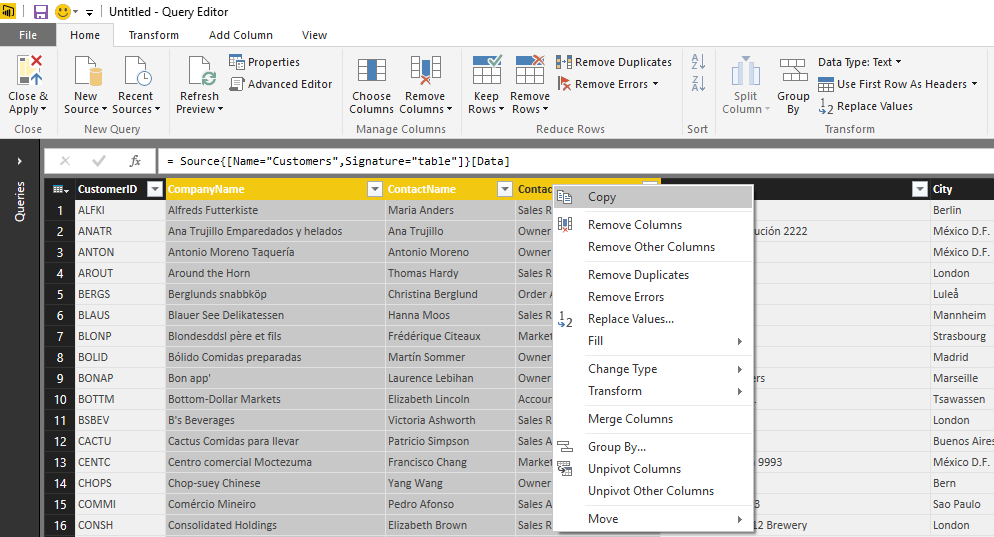
Can Power BI do this? Microsoft Power BI connects directly to the live source data. Yes, it’s very powerful and yes it also allows for ETL (extract, transform and load) to a certain extent as shown in the menu options in the image of the Query Editor. Don’t forget…Power BI is essentially a combination of the age old Excel Power Pivot and the more recent Power Query, Power View and a few other components. So yes, with a combination of all of those, ETL to a certain extent is very much possible. This is very handy when it comes to small data sets. On a self-service level, users can quickly build some simple reports and pretty looking dashboards from their live data source. Power BI also handles JOINS of two or more tables when needed, but mostly limited to Left outer joins. But in scenarios where there are multiple data sources and large data volumes, the need for a data warehouse becomes inevitable.
In fact, when you have a data warehouse that is set to auto refresh every night, Power BI can be a powerful reporting and data visualization tool, when reading data from a single data source, which is the data warehouse itself. This is where a self-service model of Power BI comes in real useful. Also, speed and performance is far better in Power BI when connected to a single data source.
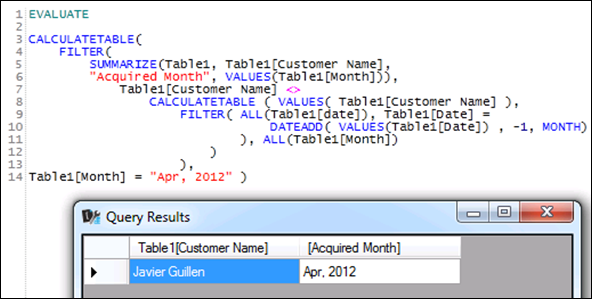
Frankly, it is the DIY or self-service BI aspect of Power BI that got you hooked in the first place. The pretty looking dashboards available at the click of a mouse button and the natural language search engine bowled you over. And yes, that part of Power BI is really attractive, easy and powerful. But for it to play the role of a full-fledged data warehouse, users would be expected to master DAX coding or M. That’s a whole new coding language. Again, much of it is in the form of add ins to Excel functions. I don’t believe it can be compared to the power, flexibility and stability of SQL with its data warehousing capabilities via SSIS (Sql Server Integration Services). But it can be real handy for a data analyst with some mastery in Excel functions for smaller data sets. Power BI cannot be compared to the vast data cleansing mechanisms possible in SQL. In the instance of having multiple data analysts using Power BI and working on different data sets, though they could share the reports and dashboards with other users via the web portal, there would not be a single central structured data repository. You would end up with multiple data repositories once again, which is exactly what you are trying to move away from.
AN EXAMPLE DAX CODE:
Lastly, a data warehouse is a central data repository for clean, consistent and structured data from multiple data sources. This could most often end up in a sizable volume which needs a fairly decent hardware box with enough memory and a powerful processor. Hence they are usually on a SQL server box either separately or as another database instance on their ERP server. In comparison, Power BI is designed to be used at the desktop level, connecting live directly to the source data. Each time you connect to multiple data sources within Power BI and upload, it creates a dataset on your local desktop. In addition, all of the ETL processes you perform on your dataset prior to reporting is done at the desktop level. The data refresh depends on the type of subscription. The free version of Power BI allows for one daily refresh, whereas the Pro version allows for up to a max of 8 refreshes per day.
In conclusion, in my opinion, I think Power BI is a fantastic ETL and reporting tool for small data sets whilst there still exists a need for a data warehouse to cater to large enterprises and complex data integration and data cleansing solutions. This is where the BI360 data warehouse module is so handy, enabling users to very quickly build a structured data warehouse in a matter of hours.
Santosh Chandran is the Business Development Manager for BI360 Business Intelligence at Olympic Software. He regularly blogs about business intelligence and corporate performance management. You can follow him on Twitter or on LinkedIn. Please contact him directly if you would like to find out how BI360 can improve your business results through better decision making, phone +649 980 3964 or email: santoshc@olympic.co.nz